Gallery
INDEX
Last updated on February 22, 2025
- Data source: 1-year GPM DPR KuPR V07
- Data source: 16-year TRMM PR V07A at each 0.01 degree grid
- Data source: 24-year TRMM PR and GPM DPR KuPR V07A
- Data source: TRMM PR V8 + GPM DPR KuPR 06A, 1998/01-2021/8
- Data source: 16-year TRMM PR v.8 (06A)
- Data source: 16-year TRMM PR 2A25 v.7 at each 0.01 degree grid
- Data source: 5 year GPM DPR KuPR 06A
Data source: 1-year GPM DPR KuPR V07
Accumulation of Spaceborne Radar-captured Precipitation Systems
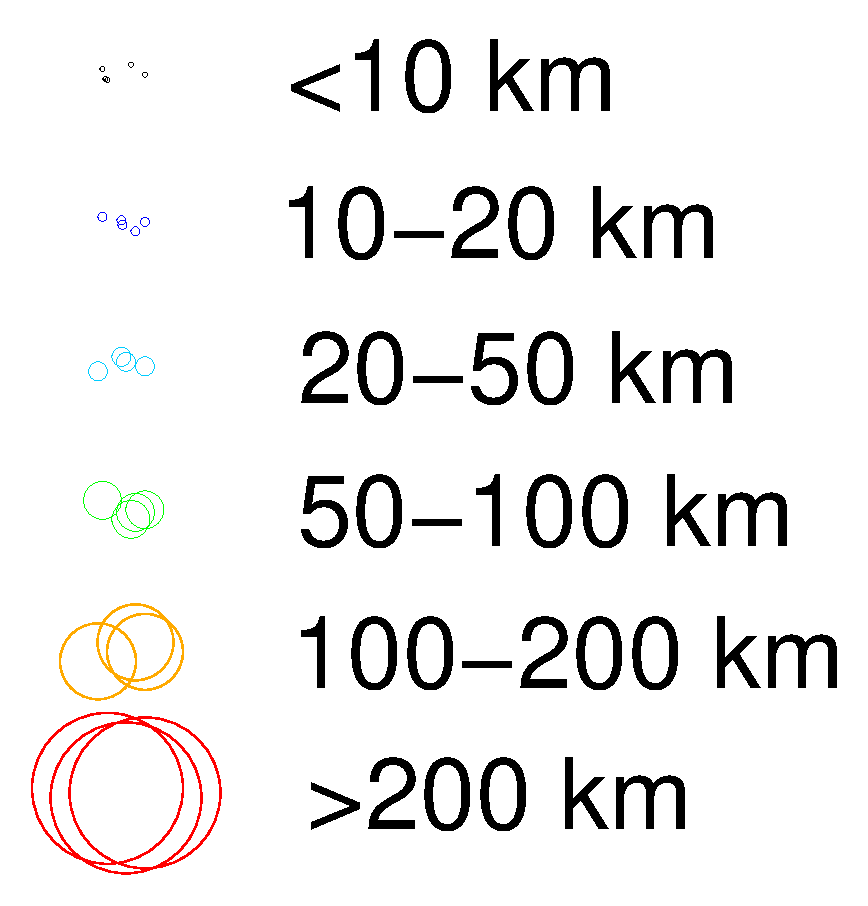
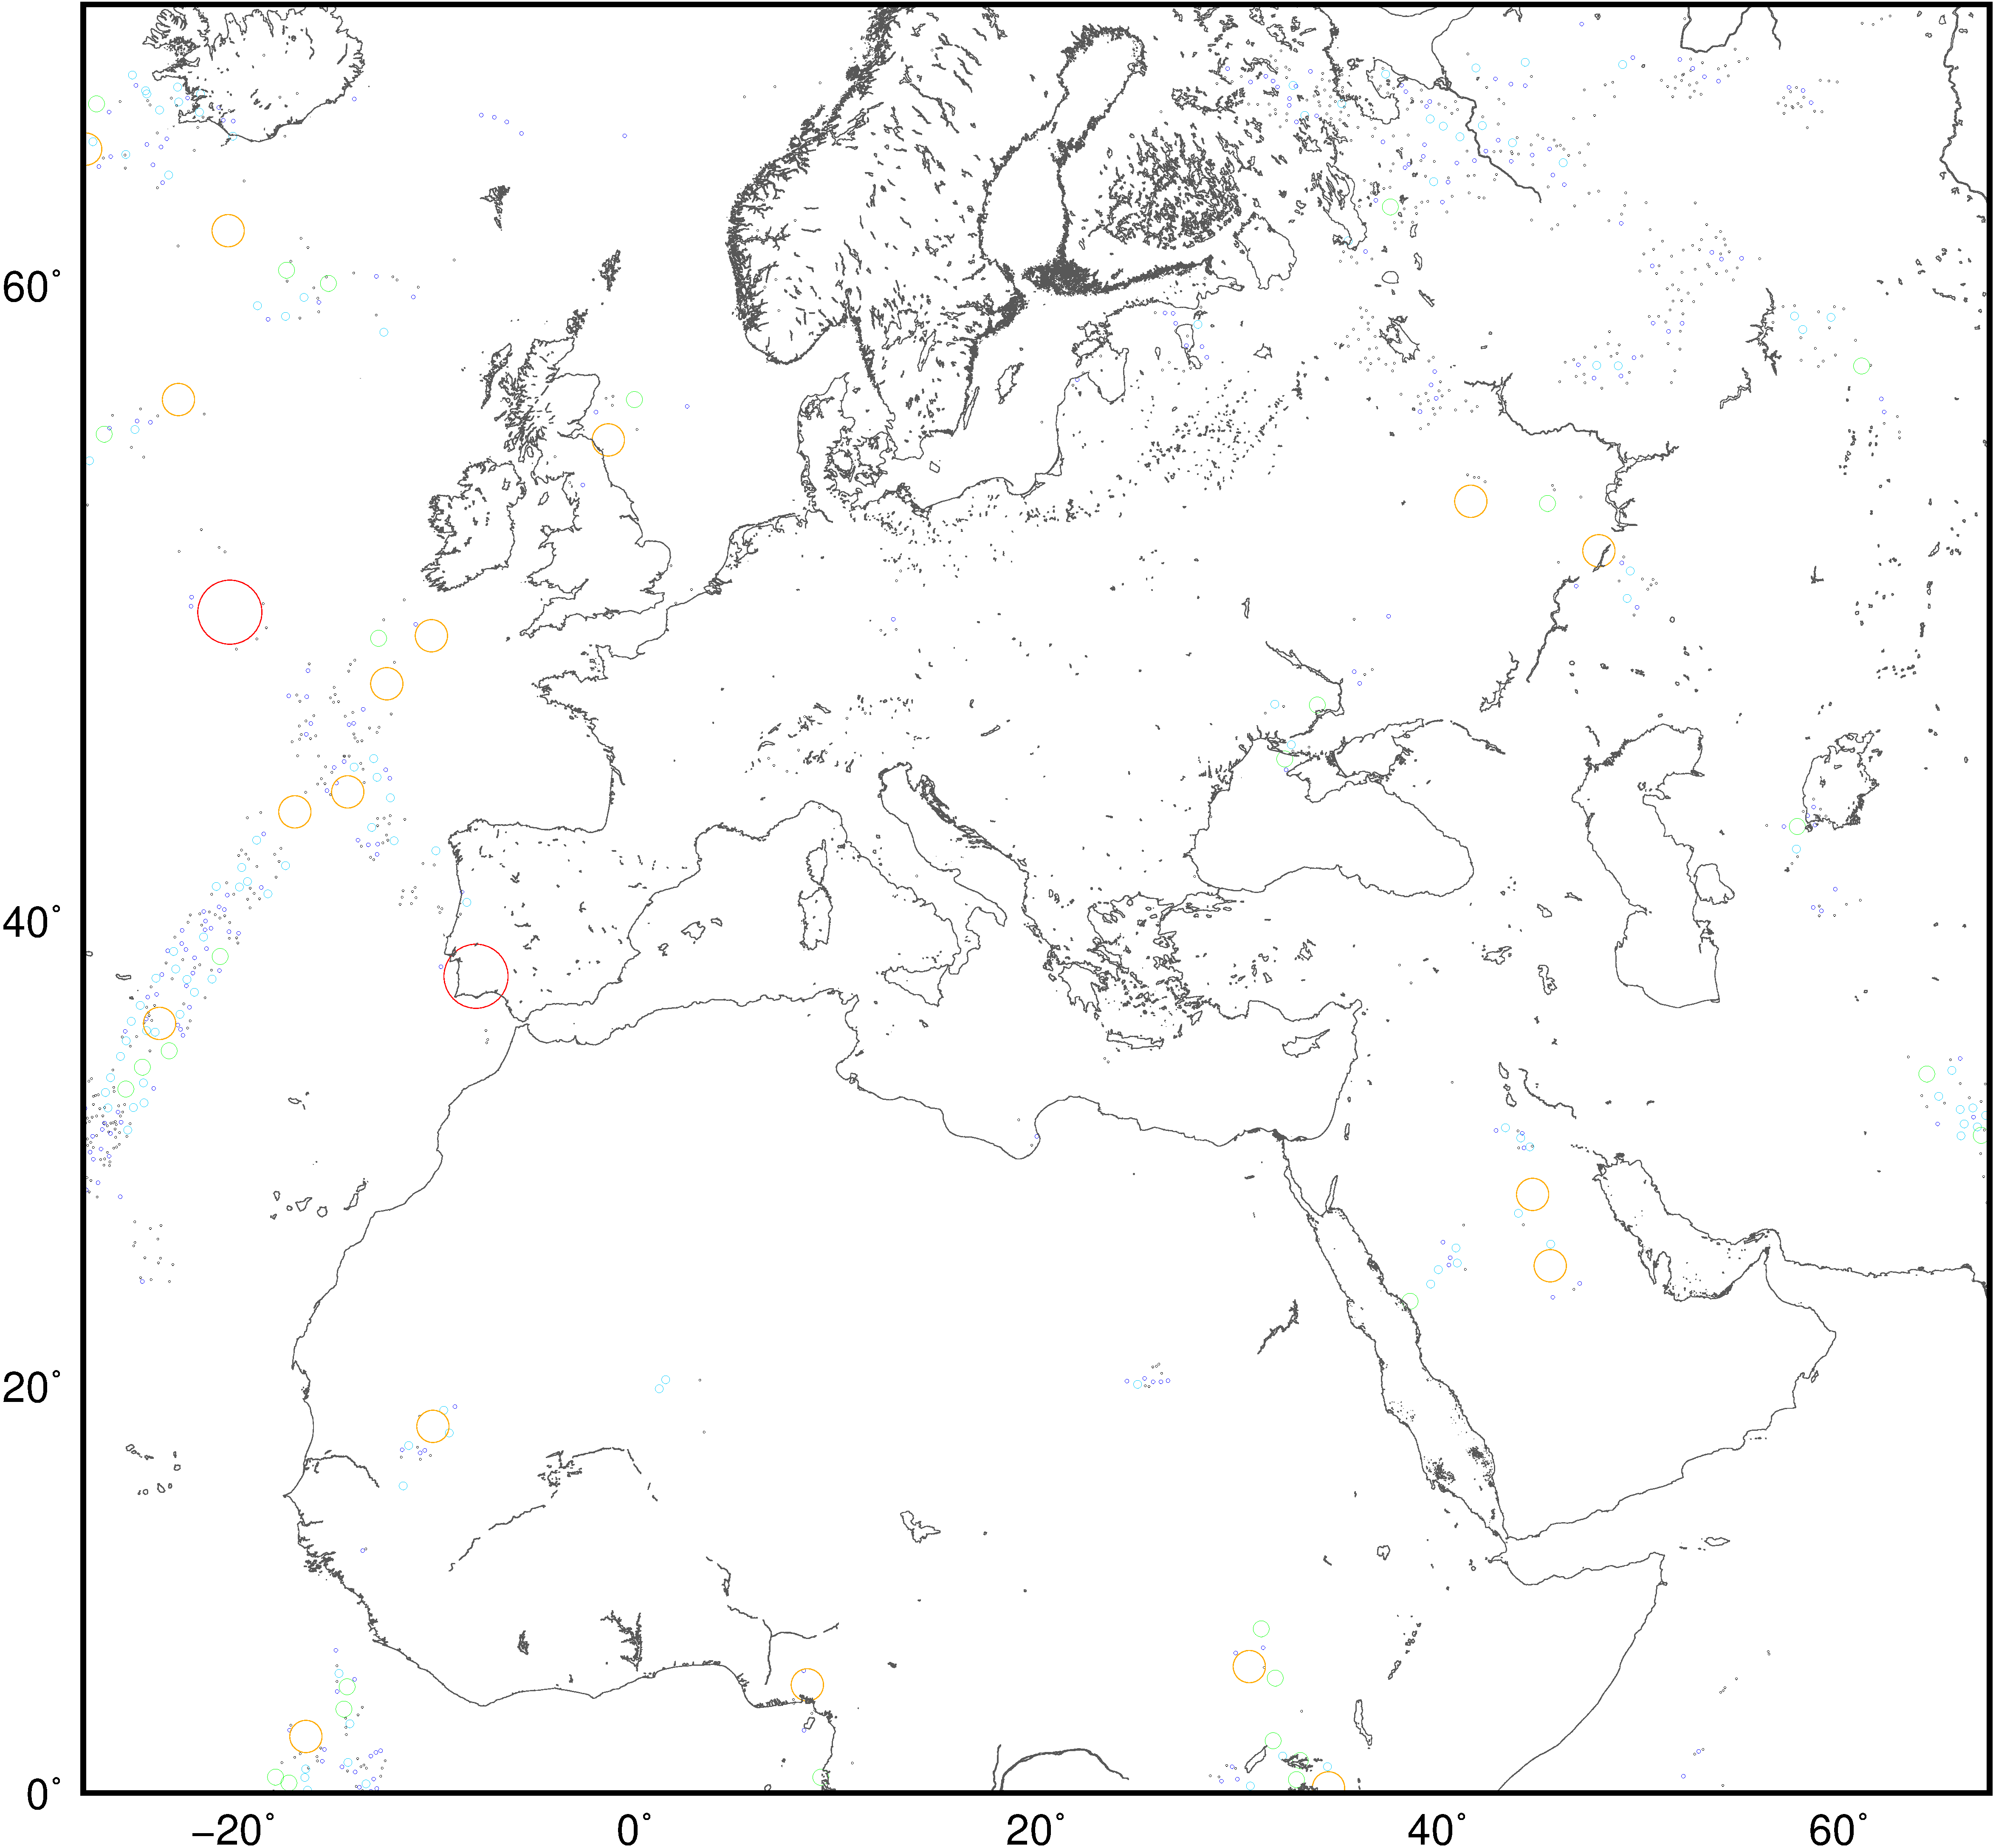
This shows the groups of precipitation systems observed by GPM DPR KuPR since April 1, 2014. Each system is defined as a continuous precipitation area. Large-scale precipitation is truncated at the edge of the scan, and due to sensitivity limitations, the area is smaller than the actual precipitation area. However, this statistic shows the breakdown of precipitation data observed by radar, and is interesting information for grasping the regional characteristics of precipitation of various spatial scales.
Data source: 16-year TRMM PR V07A at each 0.01 degree grid
Spatial average of accumulated precipitation data
The figure shown here is the surface precipitation distribution on a 0.01-degree grid based on TRMM PR V07A data. It covers the southern region of Kyushu in Japan. From left to right, the number of samples, the number of precipitation samples, and the amount of precipitation are shown. By averaging the surrounding precipitation data, spatially continuous information can be obtained. By moving the slider, you can see the accumulation of data and the distribution of precipitation according to different average radii.
Data source: 24-year TRMM PR and GPM DPR KuPR V07A
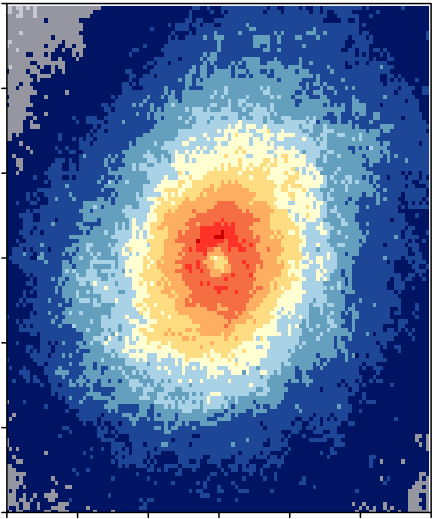
Precipitation at the center of a tropical cyclone in the western Pacific
- Data:
- TRMM PR V07A 1998/1-2014/11,
GPM DPR KuPR V07A 2014/4-2021/11 - Tropical cyclone (TC):
- Interpolated JTWC best track data
- Domain:
- See figure on the right
- Match-ups:
- Scene with precipitation within 3° from the center. PR 5000 + KuPR 1294.
Typhoon Snapshots
Full snapshot of TC-related precipitation at 1km altitude from geoid and zoomed panels by altitude
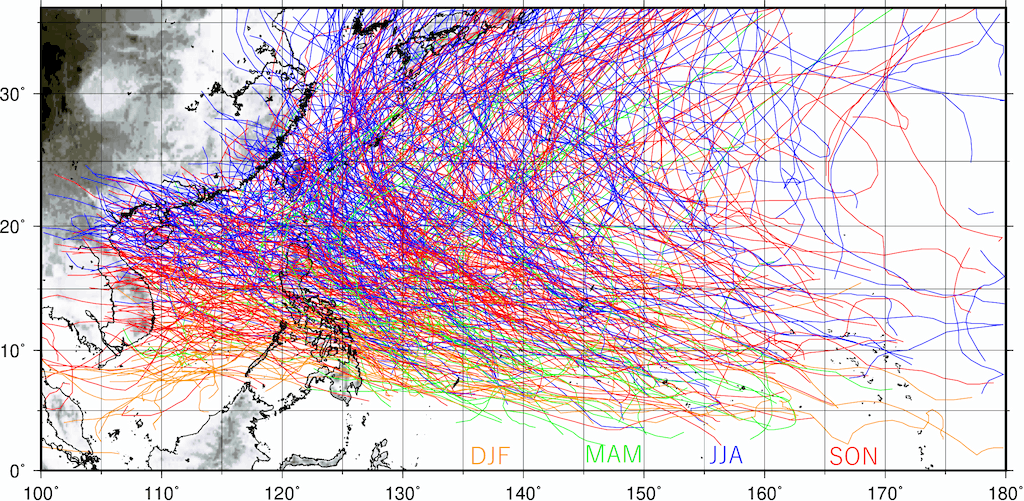
TC paths for the period covered
692 TCs, 1998-2021. JTWC best track data
Data source: TRMM PR V8 + GPM DPR KuPR 06A, 1998/01-2021/8
Monthly rainfall and the number of samples around western Japan
The figure on the right shows 0.1-degree rainfall around western Japan based on approximately 24 years of TRMM PR and GPM DPR data. The observation period can be inferred from the number of monthly samples for each 0.1 degree grid box. The number of overpasses can be estimated with the number of samples divided by approximately 5 (Hirose et al. 2017). Long-term average rainfall is classified by scale-based systems, where S, M, L, and vL denote the type of storm classified by individual rainy areas < 10, 10-100, 100-200, > 200 km, respectively.

Data source: 16-year TRMM PR v.8 (06A)
Spatiotemporal variation of precipitation and sampling uncertainty
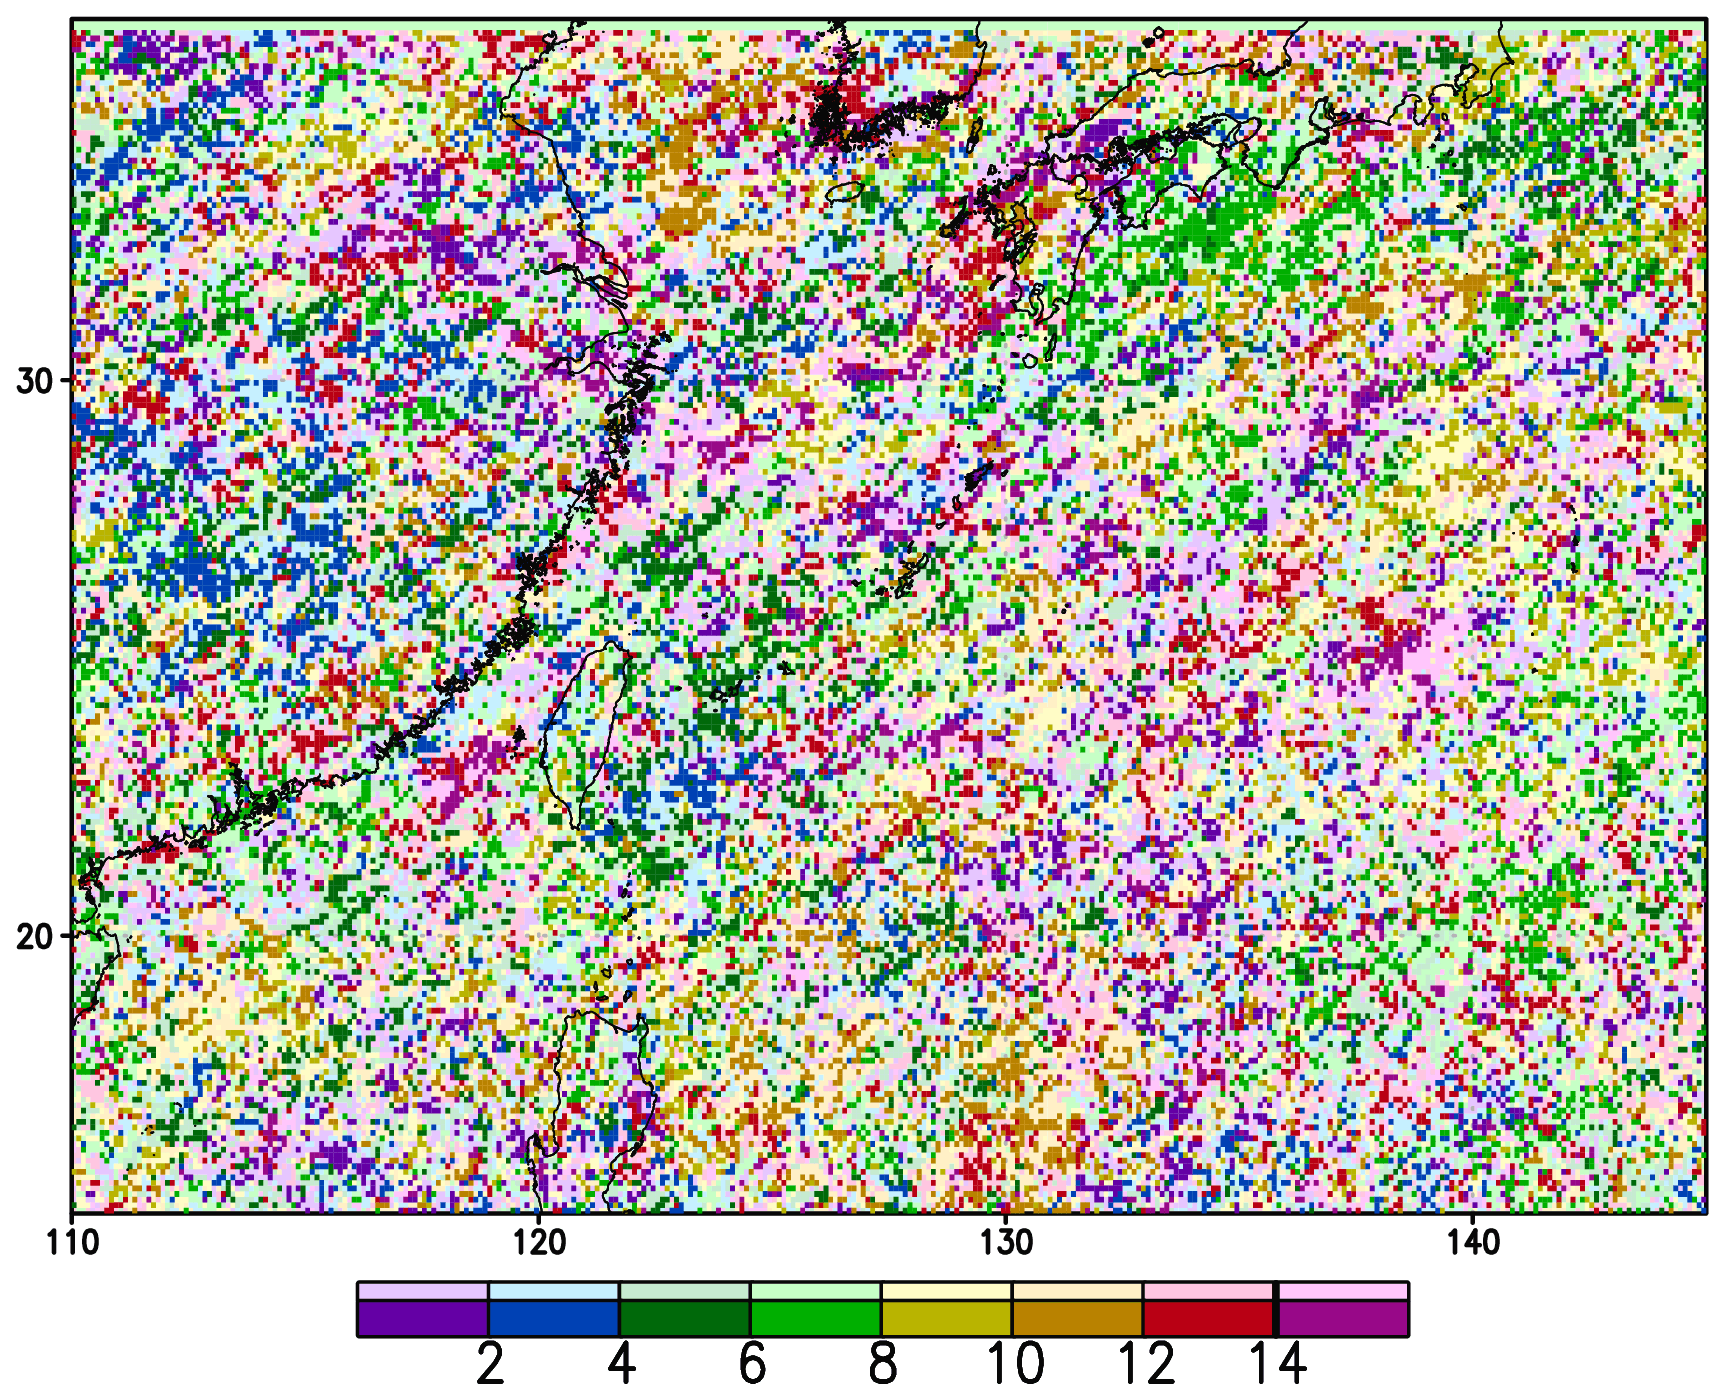
The day of the week and the moon age of maximum precipitation are shown below. The spatial resolution is 0.1 degree. The pixels having negative anomaly 1-day or 1-moon-age before or after the time of maximum precipitation are deemphasized by light-colored shadings. Note the possibility of sampling error. The time and month of maximum precipitation can be found on our “Rain map (Cesium Ver.)”New Window page.
Weekly Cycle
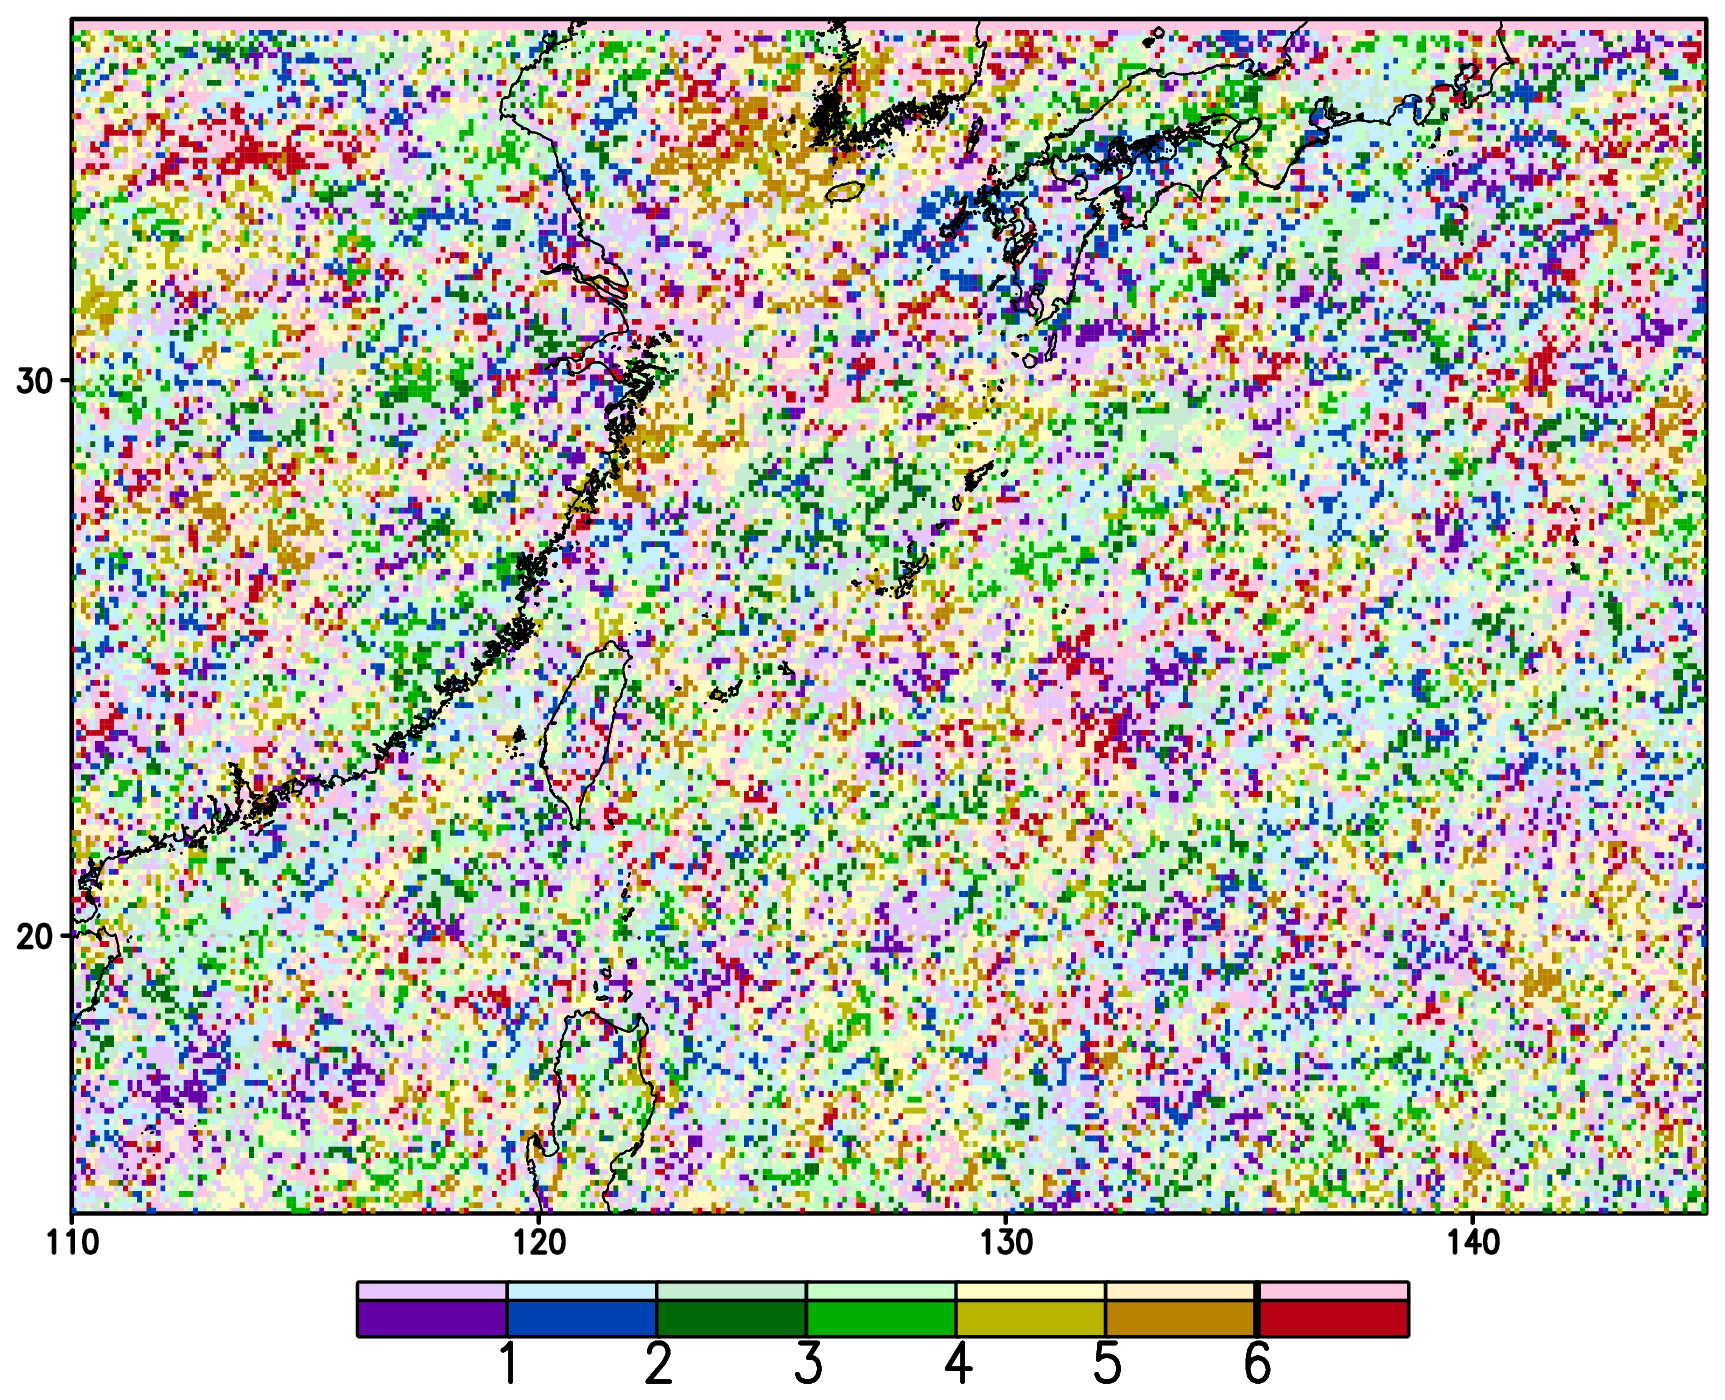
Lunar Cycle
Data source: 16-year TRMM PR 2A25 v.7 at each 0.01 degree grid
Finescale rainfall climatology over the Hawaiian Islands according to the sequential data period
The following figure provides an example of the stability of stored data statistical characteristics for multiple years.
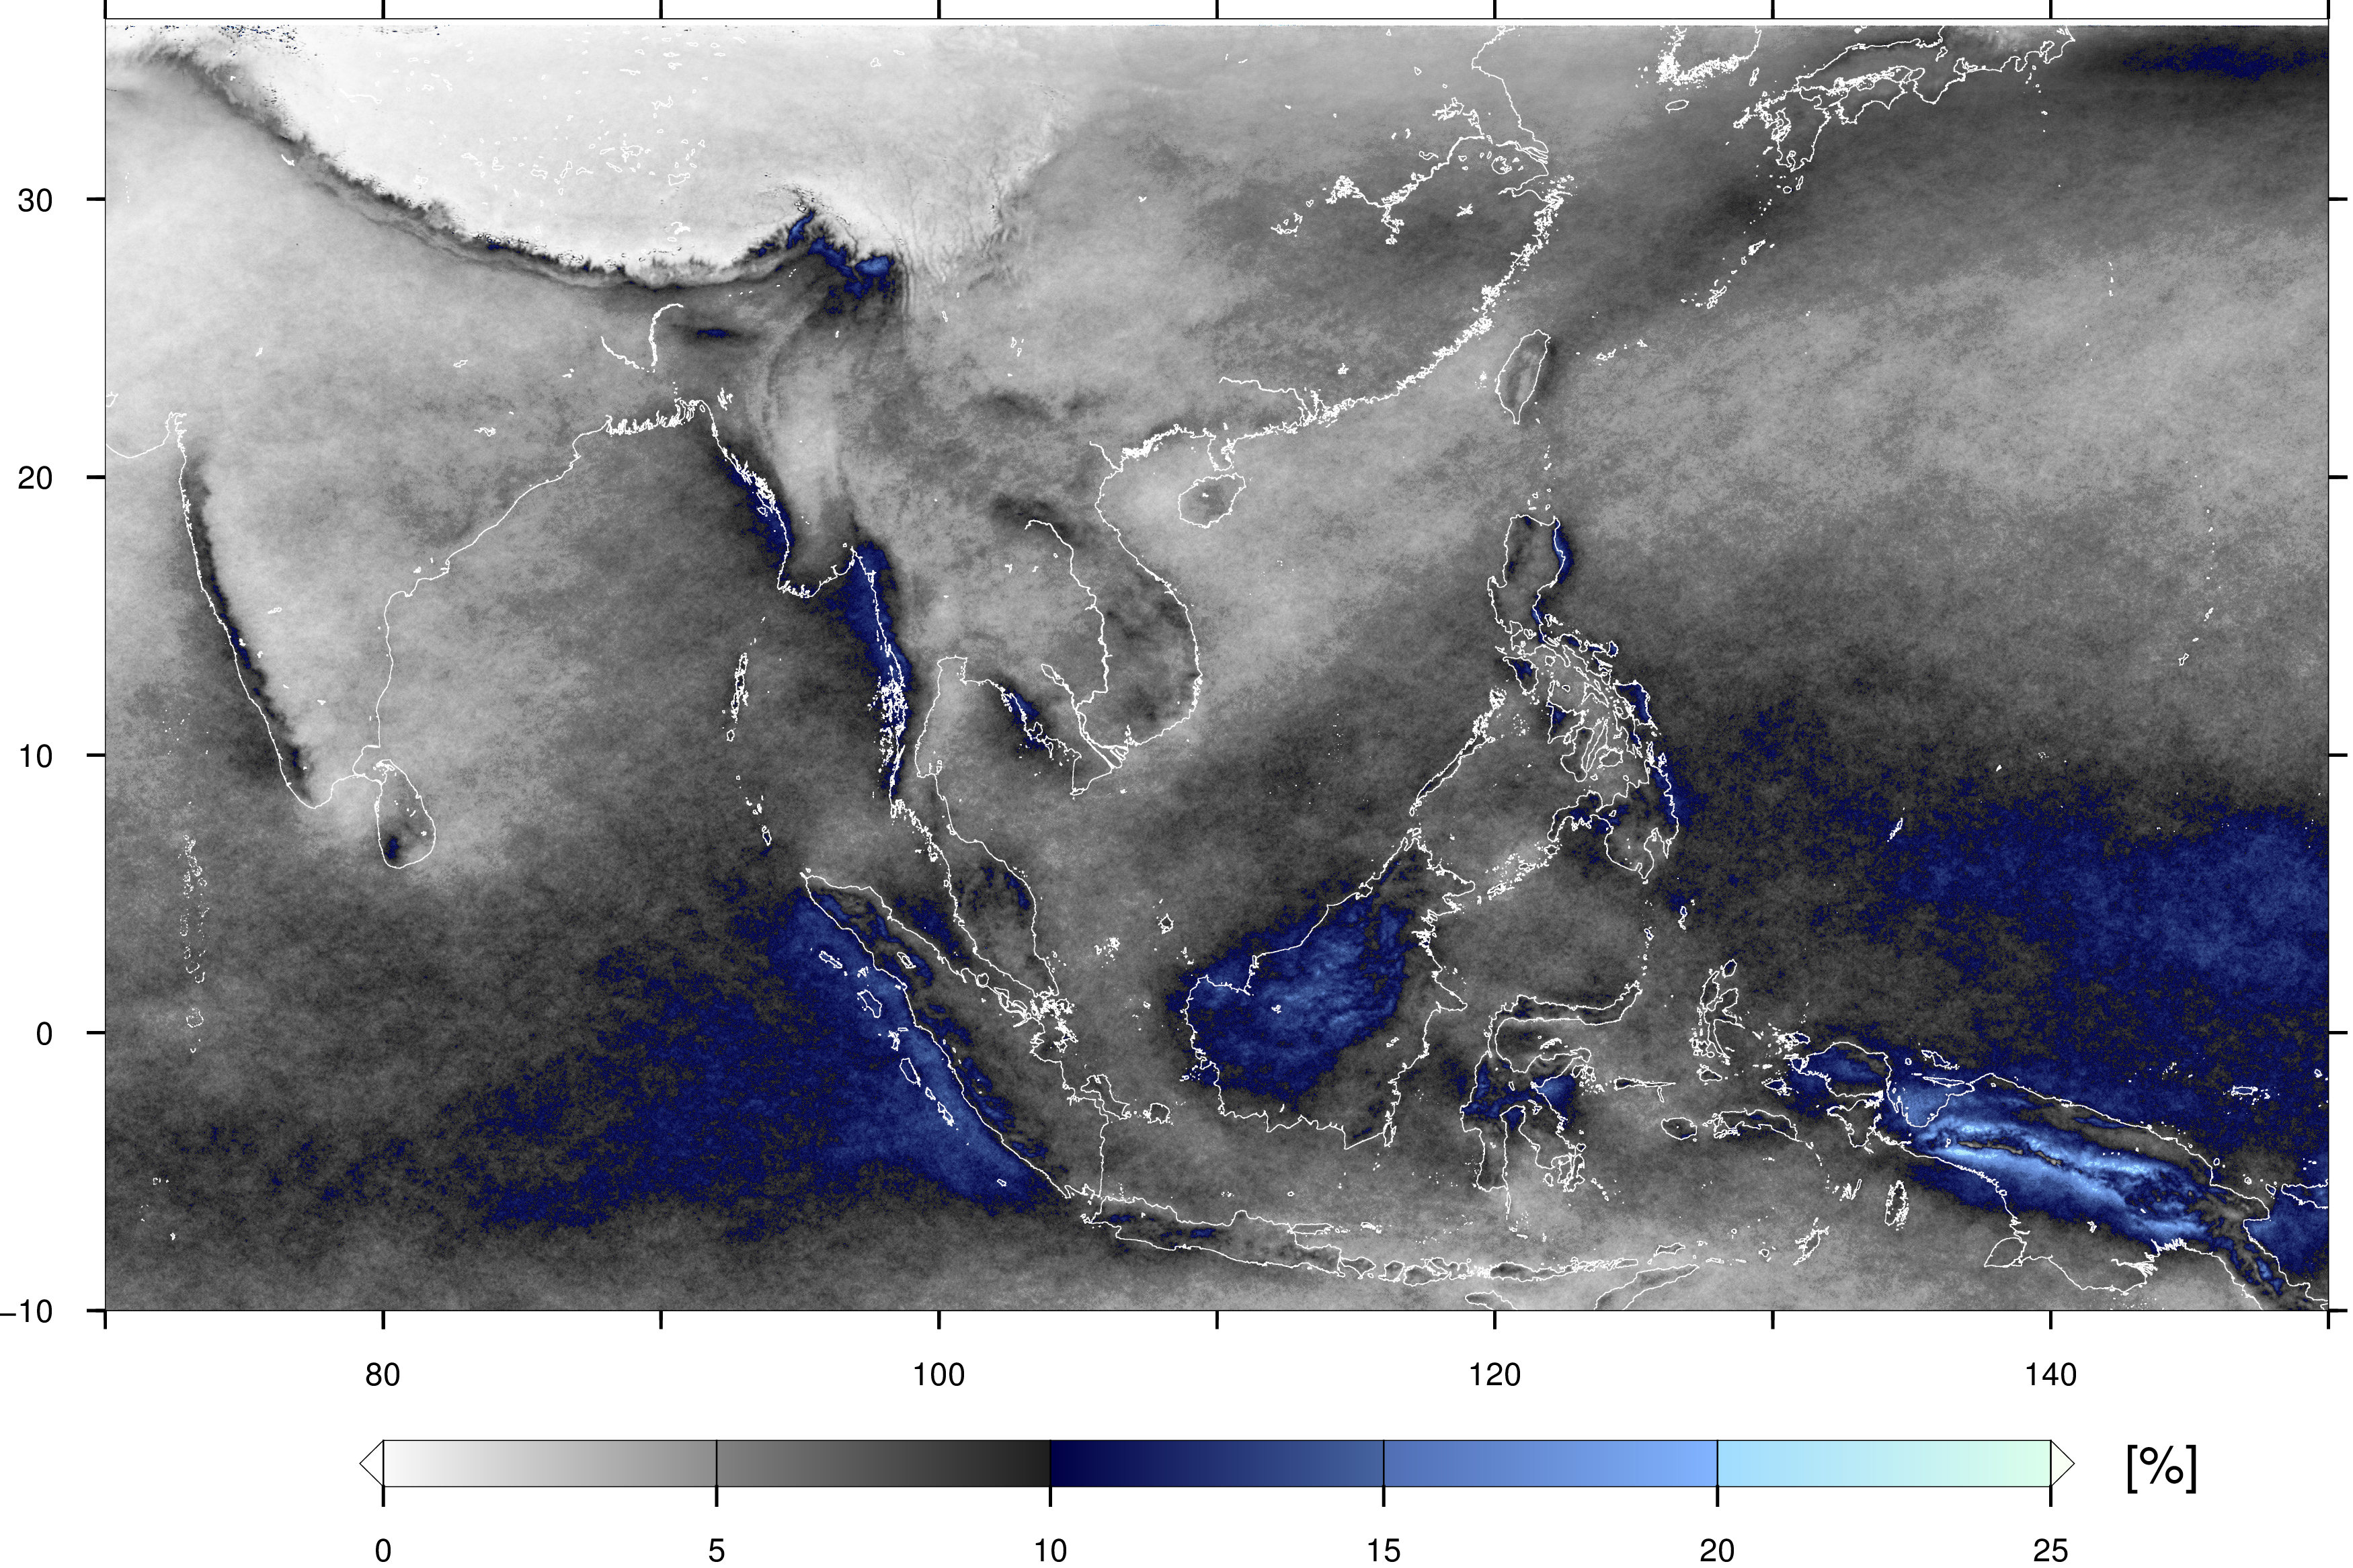
Occurrence frequency of rainfall over Asia
The precipitation frequency shown below is defined as the number of rain-certain samples (> PR's sensitivity, 17-18 dBZ) divided by the total number of samples.
Storm top height histogram over East Asia
The figure below shows the number of the storm top height from 16 years of the TRMM PR data. The vertical and horizontal resolution of this figure is 250 m and 0.01 deg, respectively.
Data source: 5 year GPM DPR KuPR 06A
Fraction of surface precipitation for each storm top height
The figure illustrates ratio of surface precipitation from storms with the different top height for each latitude and longitude. The horizontal and vertical resolution is 1 degree and 125 m, respectively. The height is calculated from the surface.
Choose the statistics for all, stratiform and convective precipitation from the drop down list.